Idaho, Raise Your Hand if You Voted in the 2010 General Election

Mountain Home Voted Just Enough – We’re Not Last!, We’re Not Last!
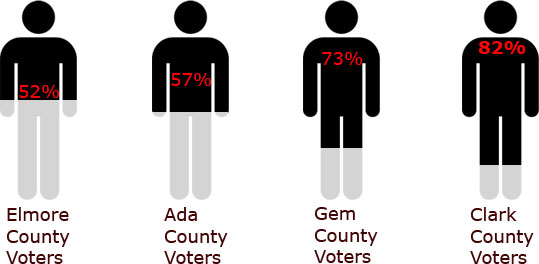
The statistics show us that only 58% of Idaho’s registered voters decided to cast a ballot on November 2nd, 2010. And when broken down in county by county numbers some locations showed more interest than others. Being a resident of Elmore County and Mountain Home Idaho, I was interested in what our numbers would look like. As the stick figure graph above shows, only about 5.2 out of every 10 potential and registered voters in Mountain Home voted. Elmore County took the 43rd spot in Idaho with Madison County preventing us from being last on the list.

The Good News isn’t Good Mountain Home
Looking at the good news, of the ~10,000 registered voters in Elmore County, 5,000 of us voted. The other good news is that even if all voters got out to the polls, the results for the races for Clerk of the Court, County Assessor and County Coroner wouldn’t have changed. Of course, these positions were uncontested seats and that’s not so great.
The Bad News is…
1. The 2 Elmore County Commissioner seats up for election could have easily gone to a different candidate. No complaining over the next few years when our county commissioners make decisions you can’t live with.
2. If recreational opportunities in Mountain Home remain stagnant, the people who didn’t vote in the WECRD election can proudly chant “Who cares!, Who cares!, Who cares!”
County by County Voting Statistics for the 2010 Idaho General Election
| Idaho County | Total Registered Voters |
Percentage |
| Clark | 425 | 82.10% |
| Gem | 9447 | 73.00% |
| Butte | 1687 | 69.00% |
| Bear Lake | 3365 | 67.70% |
| Washington | 5326 | 67.00% |
| Idaho | 10249 | 66.00% |
| Lemhi | 5258 | 65.20% |
| Power | 3469 | 64.70% |
| Custer | 2905 | 64.40% |
| Franklin | 5997 | 63.80% |
| Adams | 2695 | 63.60% |
| Lewis | 2095 | 63.40% |
| Oneida | 2633 | 62.90% |
| Bonneville | 47802 | 62.10% |
| Clearwater | 4855 | 61.60% |
| Gooding | 6508 | 61.60% |
| Jefferson | 12439 | 60.90% |
| Boundary | 5962 | 60.70% |
| Cassia | 9387 | 60.40% |
| Benewah | 5120 | 60.10% |
| Owyhee | 4879 | 60.10% |
| Teton | 5752 | 59.80% |
| Valley | 6585 | 59.50% |
| Boise | 4717 | 59.40% |
| Bonner | 23970 | 59.40% |
| Minidoka | 8316 | 59.00% |
| Nez Perce | 21656 | 59.00% |
| Shoshone | 6770 | 58.90% |
| Camas | 788 | 58.50% |
| Caribou | 3920 | 58.50% |
| Kootenai | 73521 | 58.10% |
| Bingham | 20792 | 57.90% |
| Fremont | 7029 | 57.90% |
| Payette | 10548 | 57.70% |
| Lincoln | 2180 | 57.50% |
| Canyon | 78428 | 57.40% |
| Ada | 215357 | 56.70% |
| Bannock | 42783 | 56.00% |
| Jerome | 8558 | 55.40% |
| Latah | 22712 | 55.30% |
| Twin Falls | 34438 | 55.30% |
| Blaine | 12431 | 53.80% |
| Elmore | 10550 | 51.80% |
| Madison | 16227 | 48.10% |
| Total | 790531 | 58.10% |

Didn’t vote in the 2010 General Election? Then you likely don’t read the Bondyweb website but if you somehow got lost on your way to the National Enquirer website, leave a comment telling us why you didn’t vote.
Tim Bondy
The Bondyweb.Com author